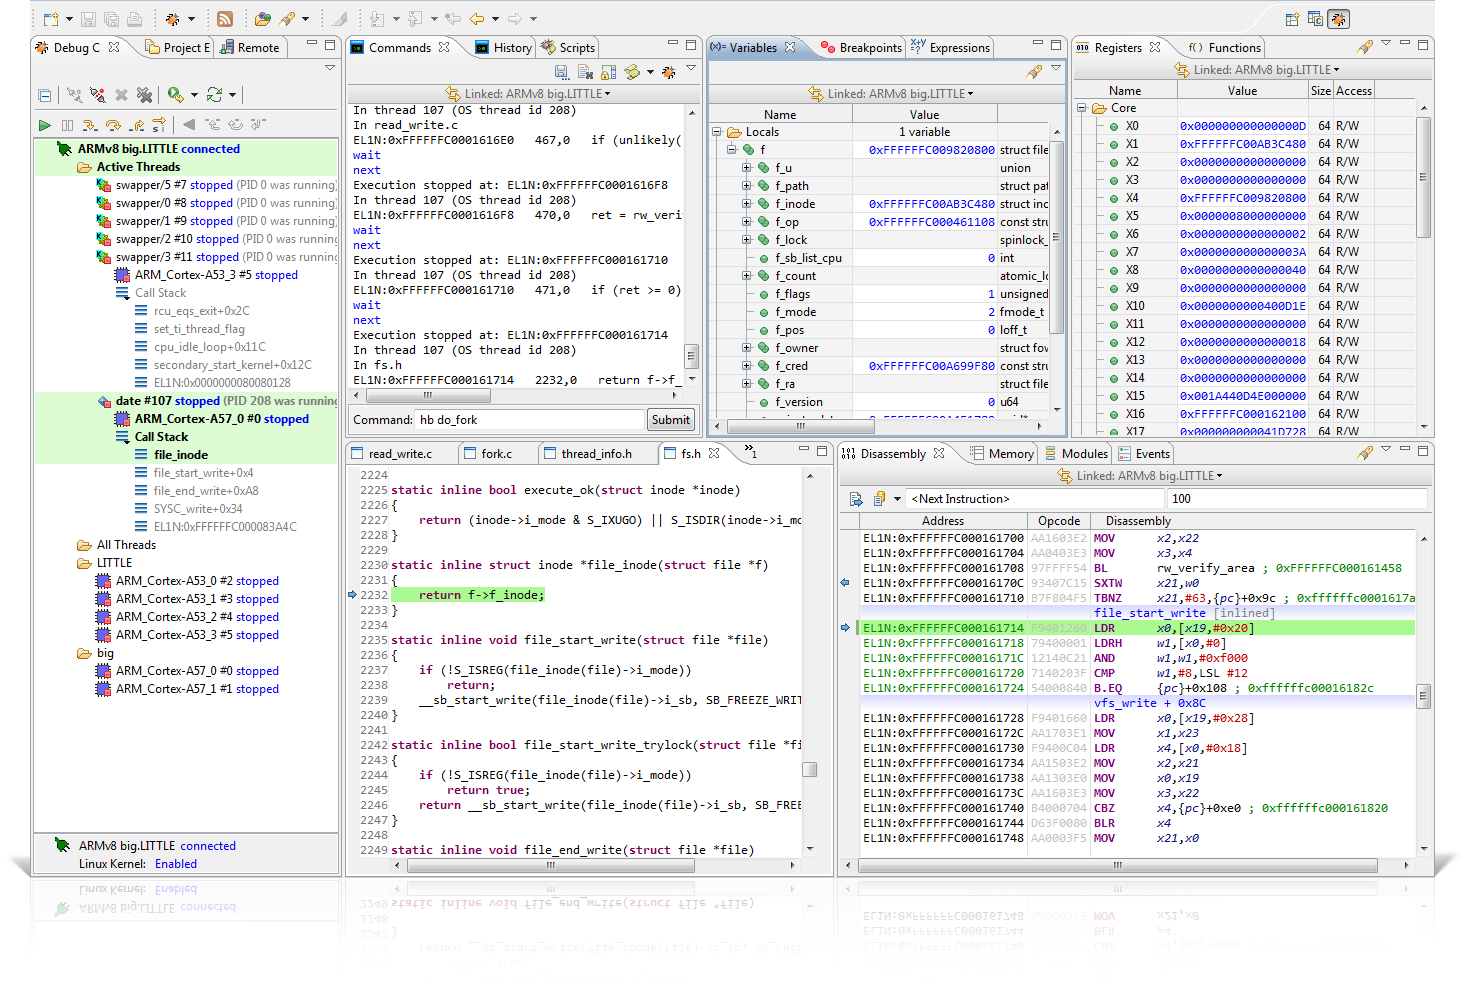
DS-5 Debugger helps you get to the root of software bugs throughout your development process. From device bring-up to application debug, it can be used to develop code on virtual platforms and hardware to help you get your products to market ahead of the competition.
A debugger for the complexity of modern SoCs
The modern architecture of DS-5 Debugger abstracts the complexity of your target platform to allow you to focus on what really matters: getting your software right. DS-5 enables you to seamlessly debug through asymmetrical (AMP), symmetrical (SMP) and heterogeneous (big.LITTLE technology) multiprocessing systems. DS-5 provides a python scripting interface for advanced users to configure each Arm CoreSight component on the SoC exactly the way they want it, while keeping the debugger interface simple and intuitive for everyone.

Debugging through the product lifecycle
The versatility of the DS-5 debugger makes it the ideal tool to standardize on across your whole team. From silicon bring-up through to application development, your team can benefit from increased collaboration and a uniform user experience. To support you through all stages, DS-5 supports a wide range of target connection methods, from the CADI interface to Arm processor models, through JTAG and trace, to Internet Protocol (IP) over Android™ Debug Bridge (ADB).

Virtual Platforms & Fast Models Development Stages: Pre-silicon,OS porting and application development Debug Connection: CADI |

Custom Hardware Development Stages: Board bring-up, OS porting and application development Debug Connection: Arm DSTREAM, Arm Keil ULINKpro family |

Development Boards Development Stages: Silicon evaluation, firmware development Debug Connection: CMSIS-DAP over USB, |

Android & Linux Devices Development Stages: Linux and Android native libraries and application Debug Connection: GDB Remote Protocol via ADB or Ethernet. |
Support for leading devices, plus your own
DS-5 ships with pre-loaded debug configurations and examples for many popular devices so all you have to do is select yours and start debugging. However, if you are designing your own SoC or are developing software for a less popular ASIC, your device may not be in the list. In these cases, DS-5 Debugger and DSTREAM can be used to quickly scan your device and create a new device configuration describing not only its processor cores but also other debug blocks such as cross-triggers, trace macrocells and trace funnels.
Target operating system awareness
Debugging is never trivial. But when your code runs on top of a third-party operating system (OS) things can get very blurred if you can’t see what what’s going on underneath. For this reason DS-5 Debugger integrates in-depth visibility into popular real-time OSs (RTOS) as well as into Linux and Android. On compatible targets you can easily visualize all tasks/threads and their call frame, set task/thread-specific breakpoints, and view kernel resources such as mailboxes and semaphores as you step through your code. When debugging the Linux kernel you can also view and load symbols for dynamically loaded modules, as well as setting pending breakpoints. Supported operating systems include:
|
 |
One size does not fit all
DS-5 has been built on a powerful and flexible framework that allows users and field engineers to customize and automate the tool to fit their needs. At its heart, the debugger brings support for two scripting interfaces: one is based on the DS-5 Debugger command line, which is similar to GDB command language, and the other, more powerful, based on Jython, the Java implementation of Python language.

Comprehensive support for Arm technologies
When selecting the tools for your next project, in addition to the basic run-control support, make sure you check whether other Arm technologies are supported. With DS-5 you will have access to the full potential of your Arm device, including support for Arm TrustZone, Cross Trigger Interface (CTI), virtualization extension, AArch32 and AArch64, Large Physical Addressing (LPA), Program / Embedded / Instrumentation / System Trace Macrocells (PTM, ETM, ITM, STM), Embedded Trace Buffers (ETB), Embedded Trace Routers (ETR), High Speed Serial Trace, Marvell SETM and more.

